Bank Institution Term Deposit Predictive Model
A bank would like to identify its customers who would potentially subscribe to its term deposits. The objective of this project is to build a robust predictive model that would help the bank identify customers who would or would not subscribe to their term deposits in the future. The predictive model can help the bank increase their campaign efficiency as they would be able to identify customers who would subscribe to their term deposit and thereby direct their marketing efforts to them. This would help them better manage their resources (e.g human effort, phone calls, time)
The Data
The data is downloaded from the UCI ML. It has 20 features varying from the personal information of customers, to previous telemarketing campaigns and social-economic factors of customers. The target is the y variable which records if the customer has subscribed to a term deposit or not.
Methods
Exploratory Data Analysis
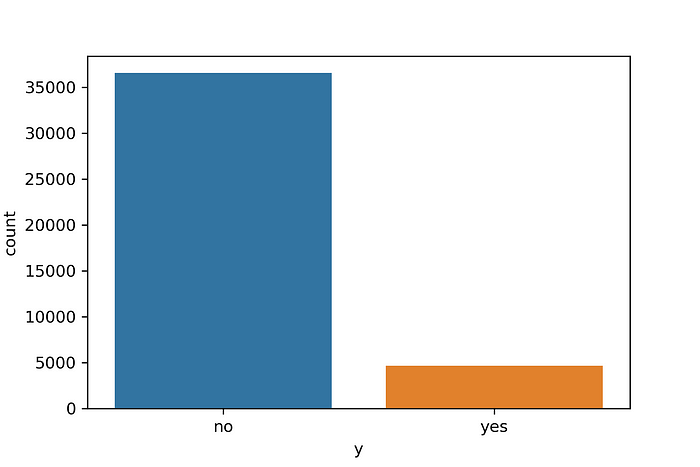
Using Python libraries (Seaborn, Pandas and Matplotlib), Univariate and Bivariate analysis is carried out on all columns. For the Univariate analysis, the categorical columns are visualized using bar charts and pie charts while the numerical columns are visualized using histograms. From the univariate analysis, it can be seen there is a huge class imbalance problem as 88% of the customers did not subscribe to a term deposit. Some numerical columns also contained outliers which could skew our analysis.

The Bivariate analysis for the categorical variables is done using cross tabulation and bar charts to compare them against the target. The numerical columns are correlated against the target in a heatmap.
Data Preprocessing
The data is aggregated to reduce variance in the data. One Hot Encoding is performed for all categorical columns. Many machine learning algorithms cannot work with categorical data directly. The categories must be converted into numbers. This is required for both the features and the target.
Outlier treatment using Isolation Forest, a tree based anomaly detection algorithm. It is an unsupervised machine learning algorithm for anomaly detection that works on the principle of isolating anomalies.
Normalization is done, using MinMax Scaler to change the values of numeric columns in the data to a common scale.
Dimensionality Reduction is applied using Principal Component Analysis(PCA).
Models
Five models were employed in this project to check which will perform best.
- Logistic Regression
- XGBoost
- Support Vector Machine (SVM)
- Random Forest
- Decision Trees
Cross Validation
The cross validation techniques were used to select the best performing models. Stratified K-Fold Cross Validation and K-Fold Validation were also compared and the Stratified K-Fold Cross validation performed better. The Stratified K-Fold helps with class imbalance problems as it preserves the class distribution in the train and test sets for each evaluation of a given model.
Evaluation Metrics
Evaluation metrics are used to measure the quality of the machine learning model. A model may perform well using one measurement from one evaluation metric, but may perform poorly using another measurement from another evaluation metric. To ensure that the model is operating correctly and optimally, we employed the following; Accuracy, Precision, Recall, F1 Score, ROC-AUC Curve.

The F1 Score and the ROC-AUC curve were selected as the best metric for imbalanced data problem. Based on these metrics, the top three performing models were; Random Forest, XGBoost and the Logistic Regression models.
References
- How to Fix k-Fold Cross-Validation for Imbalanced Classification https://machinelearningmastery.com/cross-validation-for-imbalanced-classification/#:~:text=For%20example%2C%20we%20can%20use,in%20the%20complete%20training%20dataset
- Logistic Regression with StratifiedKfold https://www.kaggle.com/sudhirnl7/logistic-regression-with-stratifiedkfold
Link to Code :
https://github.com/VictoriaAkintomide/10Academy/tree/master/week6
